💡 본 포스팅은 수업 내용, 교재, ChatGPT를 참고하여 정리한 학습 기록입니다.
글과 그림 등 모든 콘텐츠의 정리 및 작성은 본 블로그에서 직접 제작되었습니다.
Python 기초부터 Streamlit 데이터 시각화까지 정리하는 학습 기록입니다.
이 글은 '21. [Streamlit] 데이터 시각화와 사용자 입력' 입니다.
데이터 분석 결과를 공유할 때 단순한 표보다 시각화된 그래프가 훨씬 이해하기 쉽다.
Streamlit은 Python 코드만으로 데이터 시각화와 사용자 인터페이스(UI) 를 쉽게 만들 수 있는 도구이다.
이번 글에서는 Streamlit을 활용하여
- 데이터 시각화
- 사용자 입력 인터페이스
- 동적으로 바뀌는 그래프
를 만드는 방법을 정리해본다.
💡 streamlit 설치 후, pandas, numpy, matplotlib도 설치해주자.
맥북의 경우, pip 또는 python 을 사용할 때 pip3, pyhon3 로 작성해주면 된다.
pip3 install pandas numpy matplotlib
데이터 시각화 기본
Streamlit에서는 DataFrame을 이용해 간단하게 그래프를 그릴 수 있다.
먼저 예제 데이터를 만들어보자.
import streamlit as st
import pandas as pd
import numpy as np

st.title("Monthly Sales Dashboard")

months = pd.date_range("2024-01-01", periods=12, freq="ME")

sales = np.random.randint(20000, 50000, size=12)

df = pd.DataFrame({
    "Month": months.strftime("%Y-%m"),
    "Sales": sales
})
데이터를 확인해보면 다음과 같다.
st.dataframe(df)
이제 그래프를 그려보자.
라인 차트
Streamlit에서는 st.line_chart()로 간단하게 선 그래프를 만들 수 있다.
st.subheader("Monthly Sales Trend")

st.line_chart(df.set_index("Month"))
이 그래프는 월별 매출 흐름을 한눈에 보여준다.
바 차트
막대 그래프는 비교를 시각적으로 보여줄 때 유용하다.
st.subheader("Monthly Sales Comparison")

st.bar_chart(df.set_index("Month"))
이 그래프를 통해 월별 매출 규모 차이를 쉽게 확인할 수 있다.
사용자 입력 추가
Streamlit의 강력한 기능 중 하나는 사용자 입력을 쉽게 받을 수 있다는 점이다.
예를 들어 데이터 개수를 조절하는 슬라이더를 만들어보자.
num_data = st.slider("Number of Data Points", 5, 50, 20)
랜덤 데이터를 생성해 그래프를 그려보면 다음과 같다.
data = np.random.randn(num_data)

chart_data = pd.DataFrame({
    "value": data
})

st.line_chart(chart_data)
슬라이더를 움직이면 그래프가 실시간으로 바뀌는 것을 확인할 수 있다.

인터랙티브 시각화 예제
이번에는 조금 더 재미있는 예제를 만들어보자.
랜덤 데이터로 생성되는 "데이터 스트림 그래프"이다.
import streamlit as st
import pandas as pd
import numpy as np

st.subheader("Real-time Style Random Data")

points = st.slider("Number of Points", 10, 200, 50)

data = np.cumsum(np.random.randn(points))

df_random = pd.DataFrame({
    "value": data
})

st.line_chart(df_random)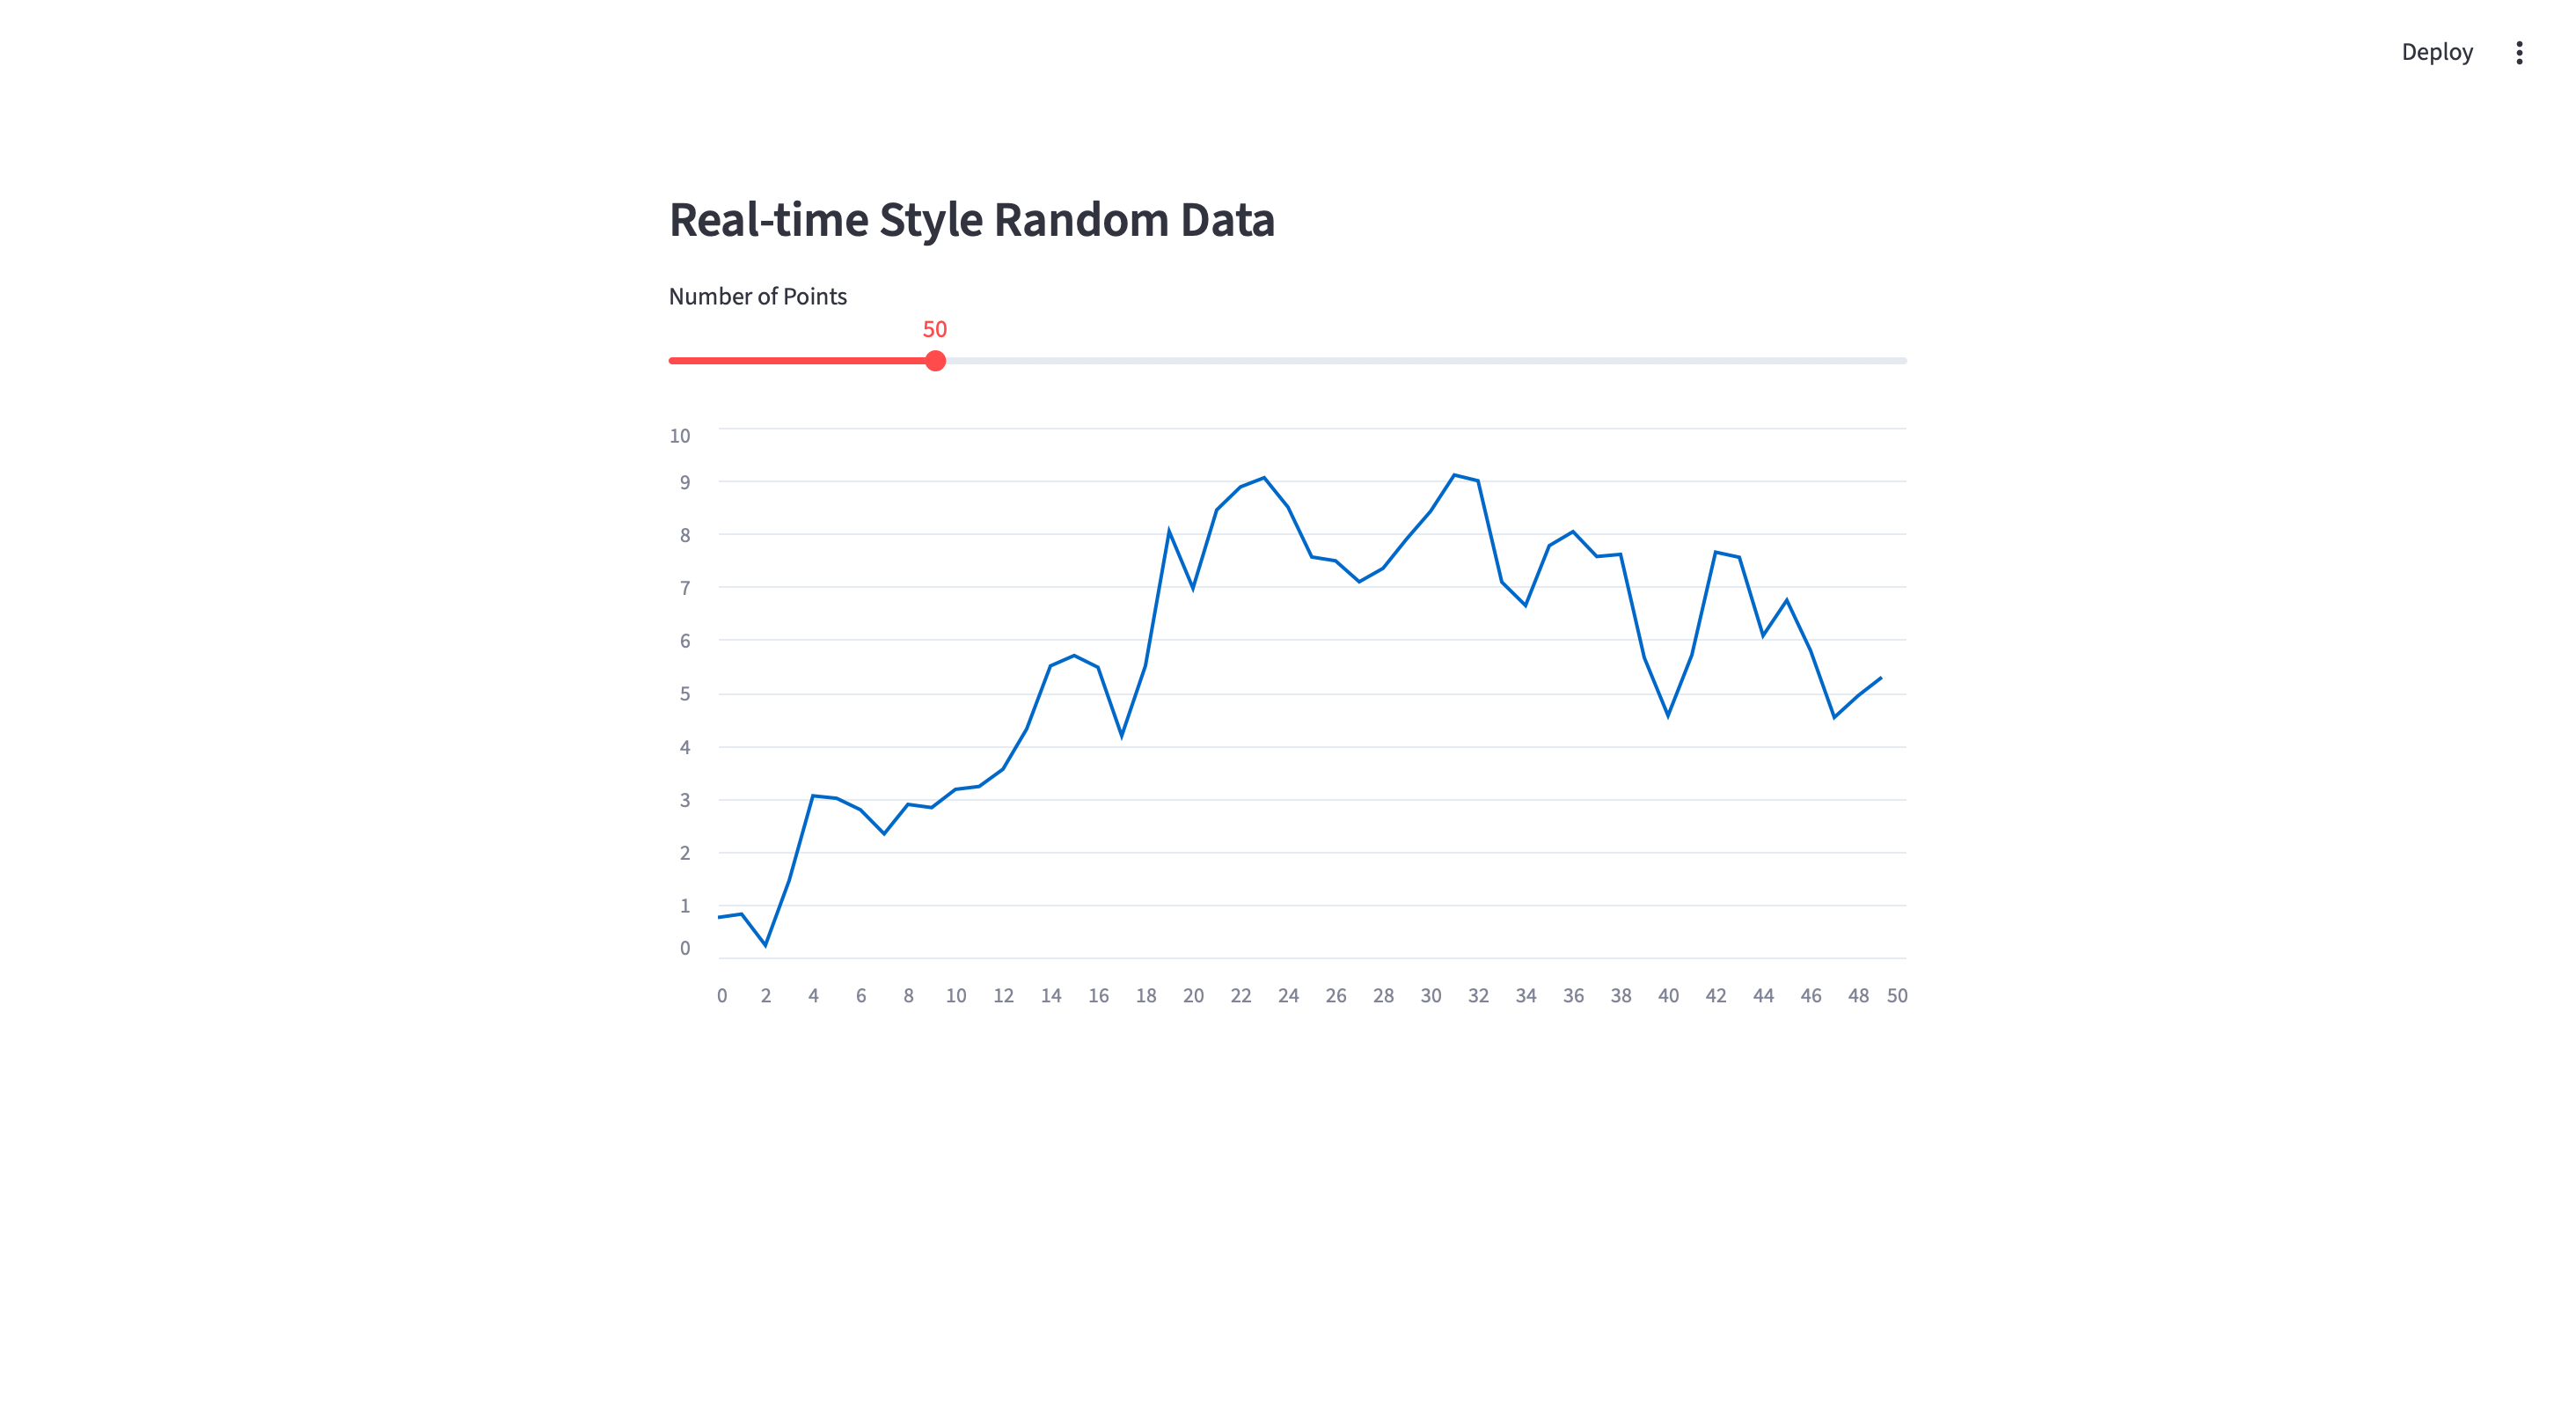
이 그래프는 랜덤하게 변화하는 데이터 흐름을 보여준다.
간단한 데이터 분석 대시보드
이번에는 수업 시간에 다룬 Python 함수들을 활용해
간단한 데이터 분석 대시보드를 만들어보자.
import streamlit as st
import pandas as pd
import numpy as np

scores = np.random.randint(60, 100, 20)

df_scores = pd.DataFrame({
    "score": scores
})

st.subheader("Score Distribution")

st.bar_chart(df_scores)


# 이 데이터에 대해 기본 통계를 계산해볼 수도 있다.
st.write("Average Score:", np.mean(scores))
st.write("Max Score:", np.max(scores))
st.write("Min Score:", np.min(scores))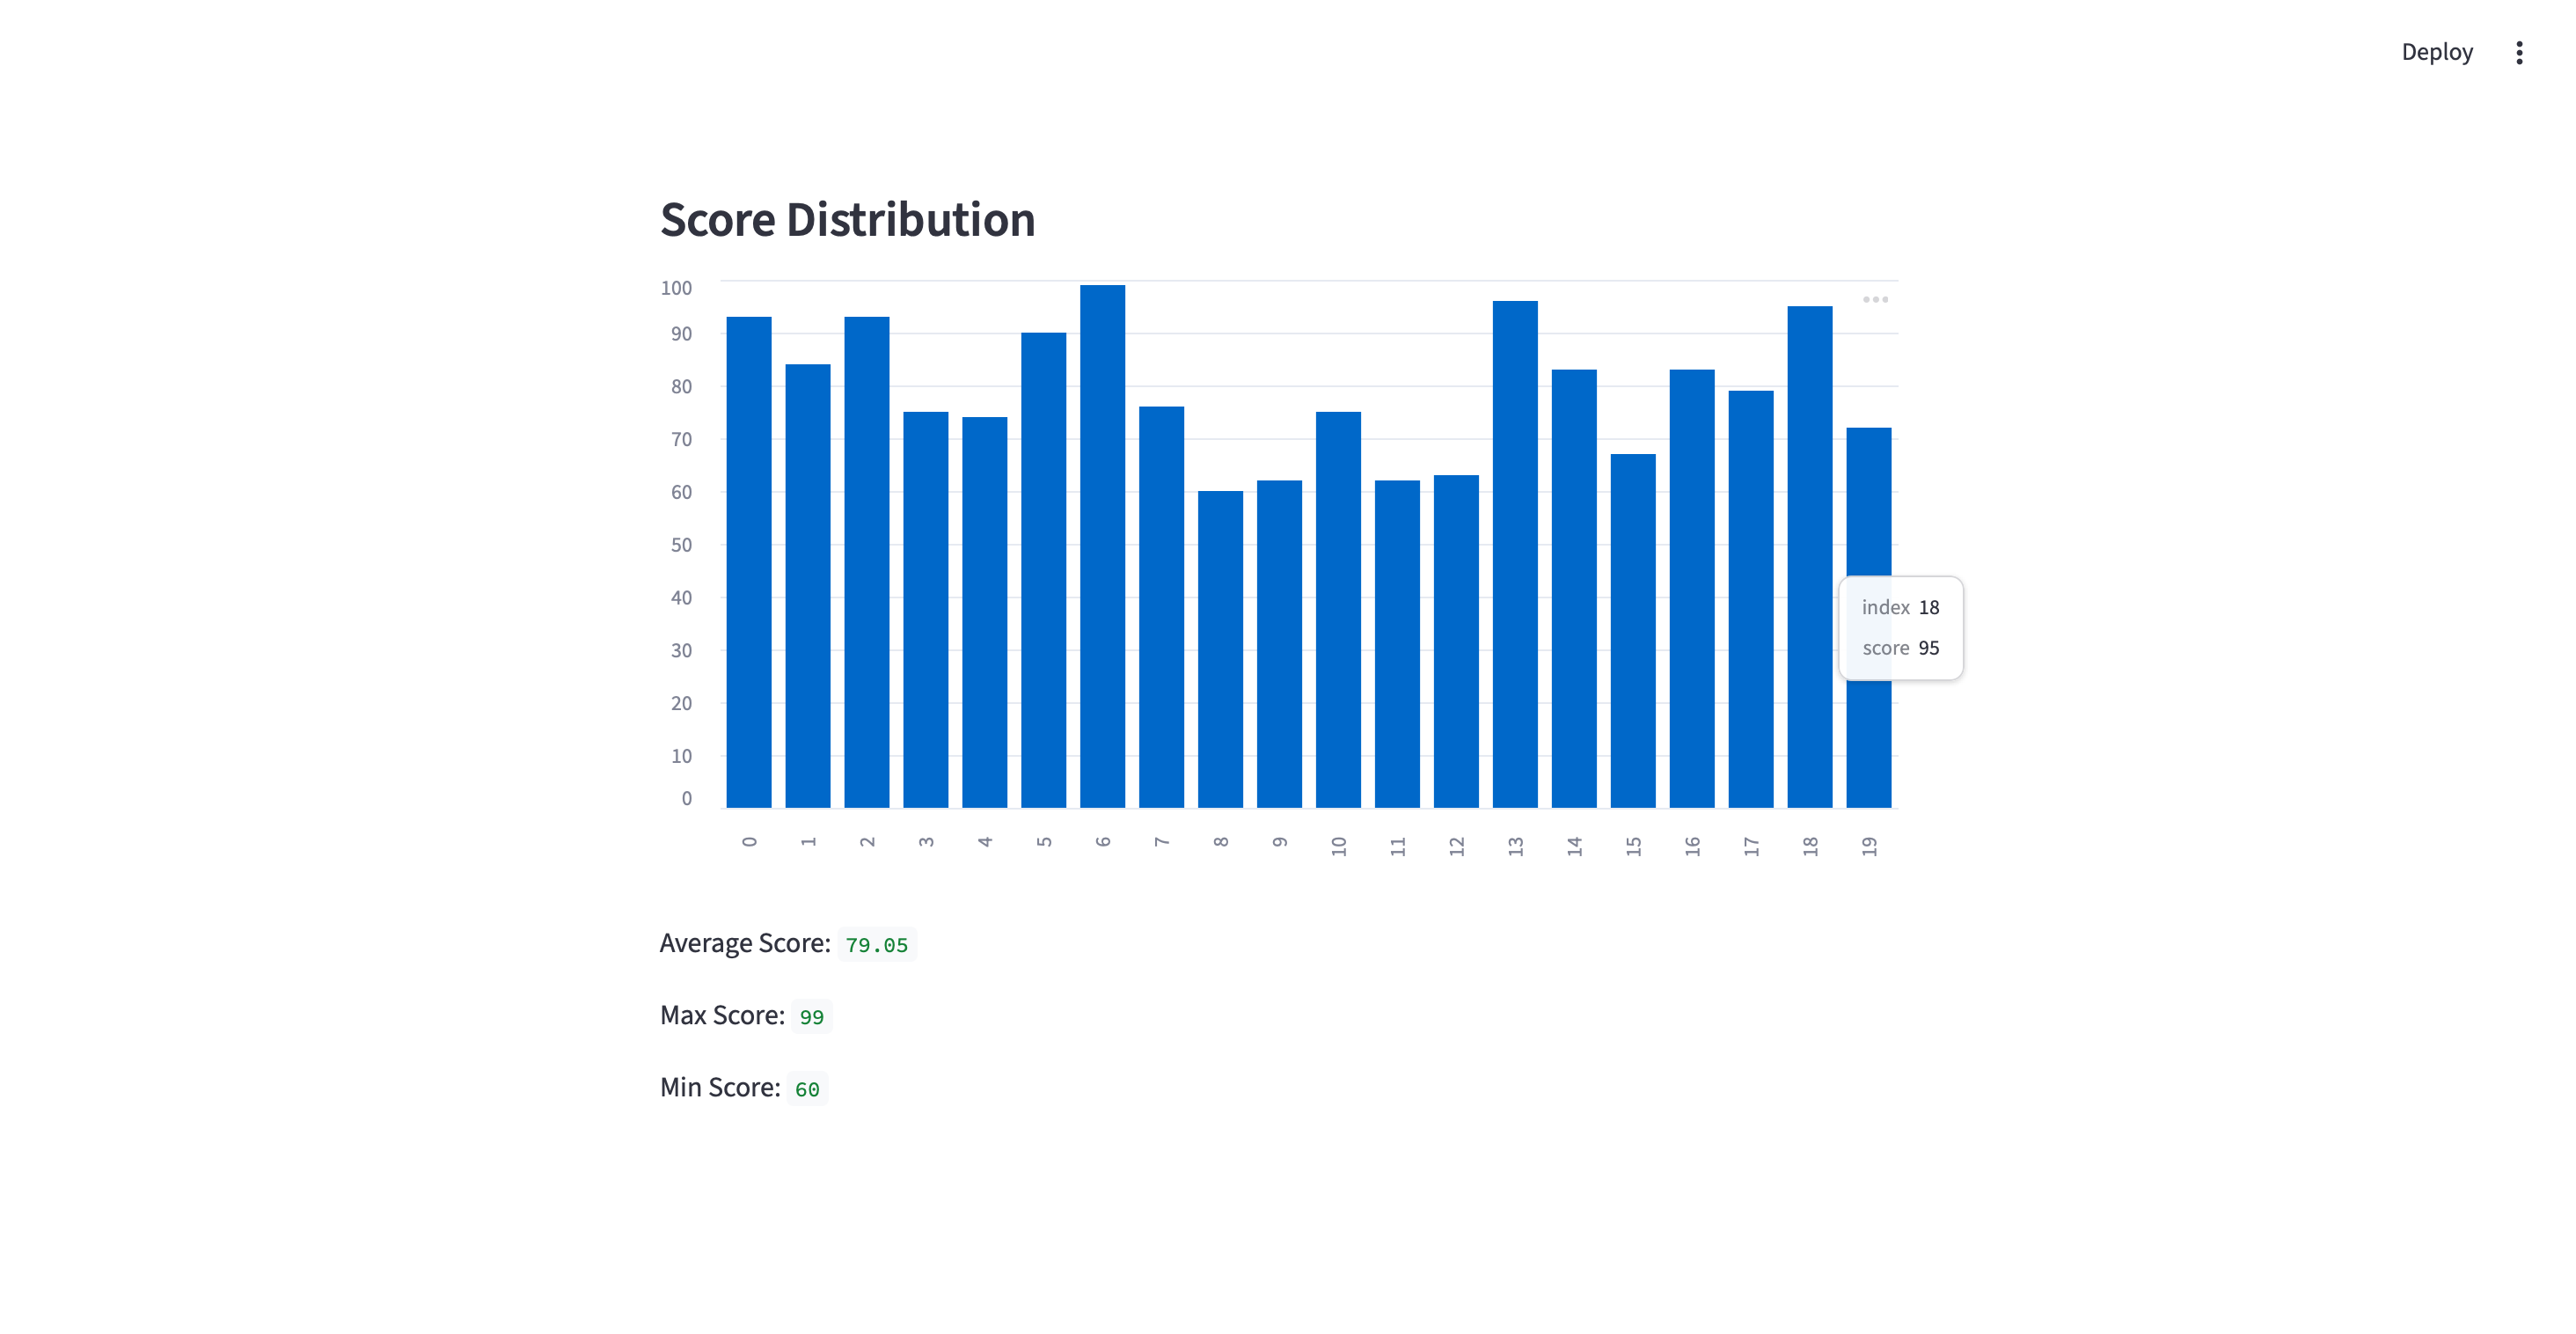
이처럼 Python에서 배운
- mean
- max
- min
같은 계산을 그대로 웹 인터페이스에서 시각적으로 표현할 수 있다.
Matplotlib 활용
Streamlit에서는 matplotlib 그래프도 사용할 수 있다.
import streamlit as st
import pandas as pd
import matplotlib.pyplot as plt

# 데이터 생성
df = pd.DataFrame({
    "Month": ["Jan", "Feb", "Mar", "Apr"],
    "Sales": [20000, 25000, 30000, 28000]
})

fig, ax = plt.subplots()

ax.plot(df["Month"], df["Sales"], marker="o")

ax.set_title("Monthly Sales Example")
ax.set_xlabel("Month")
ax.set_ylabel("Sales")

plt.xticks(rotation=45)

st.pyplot(fig)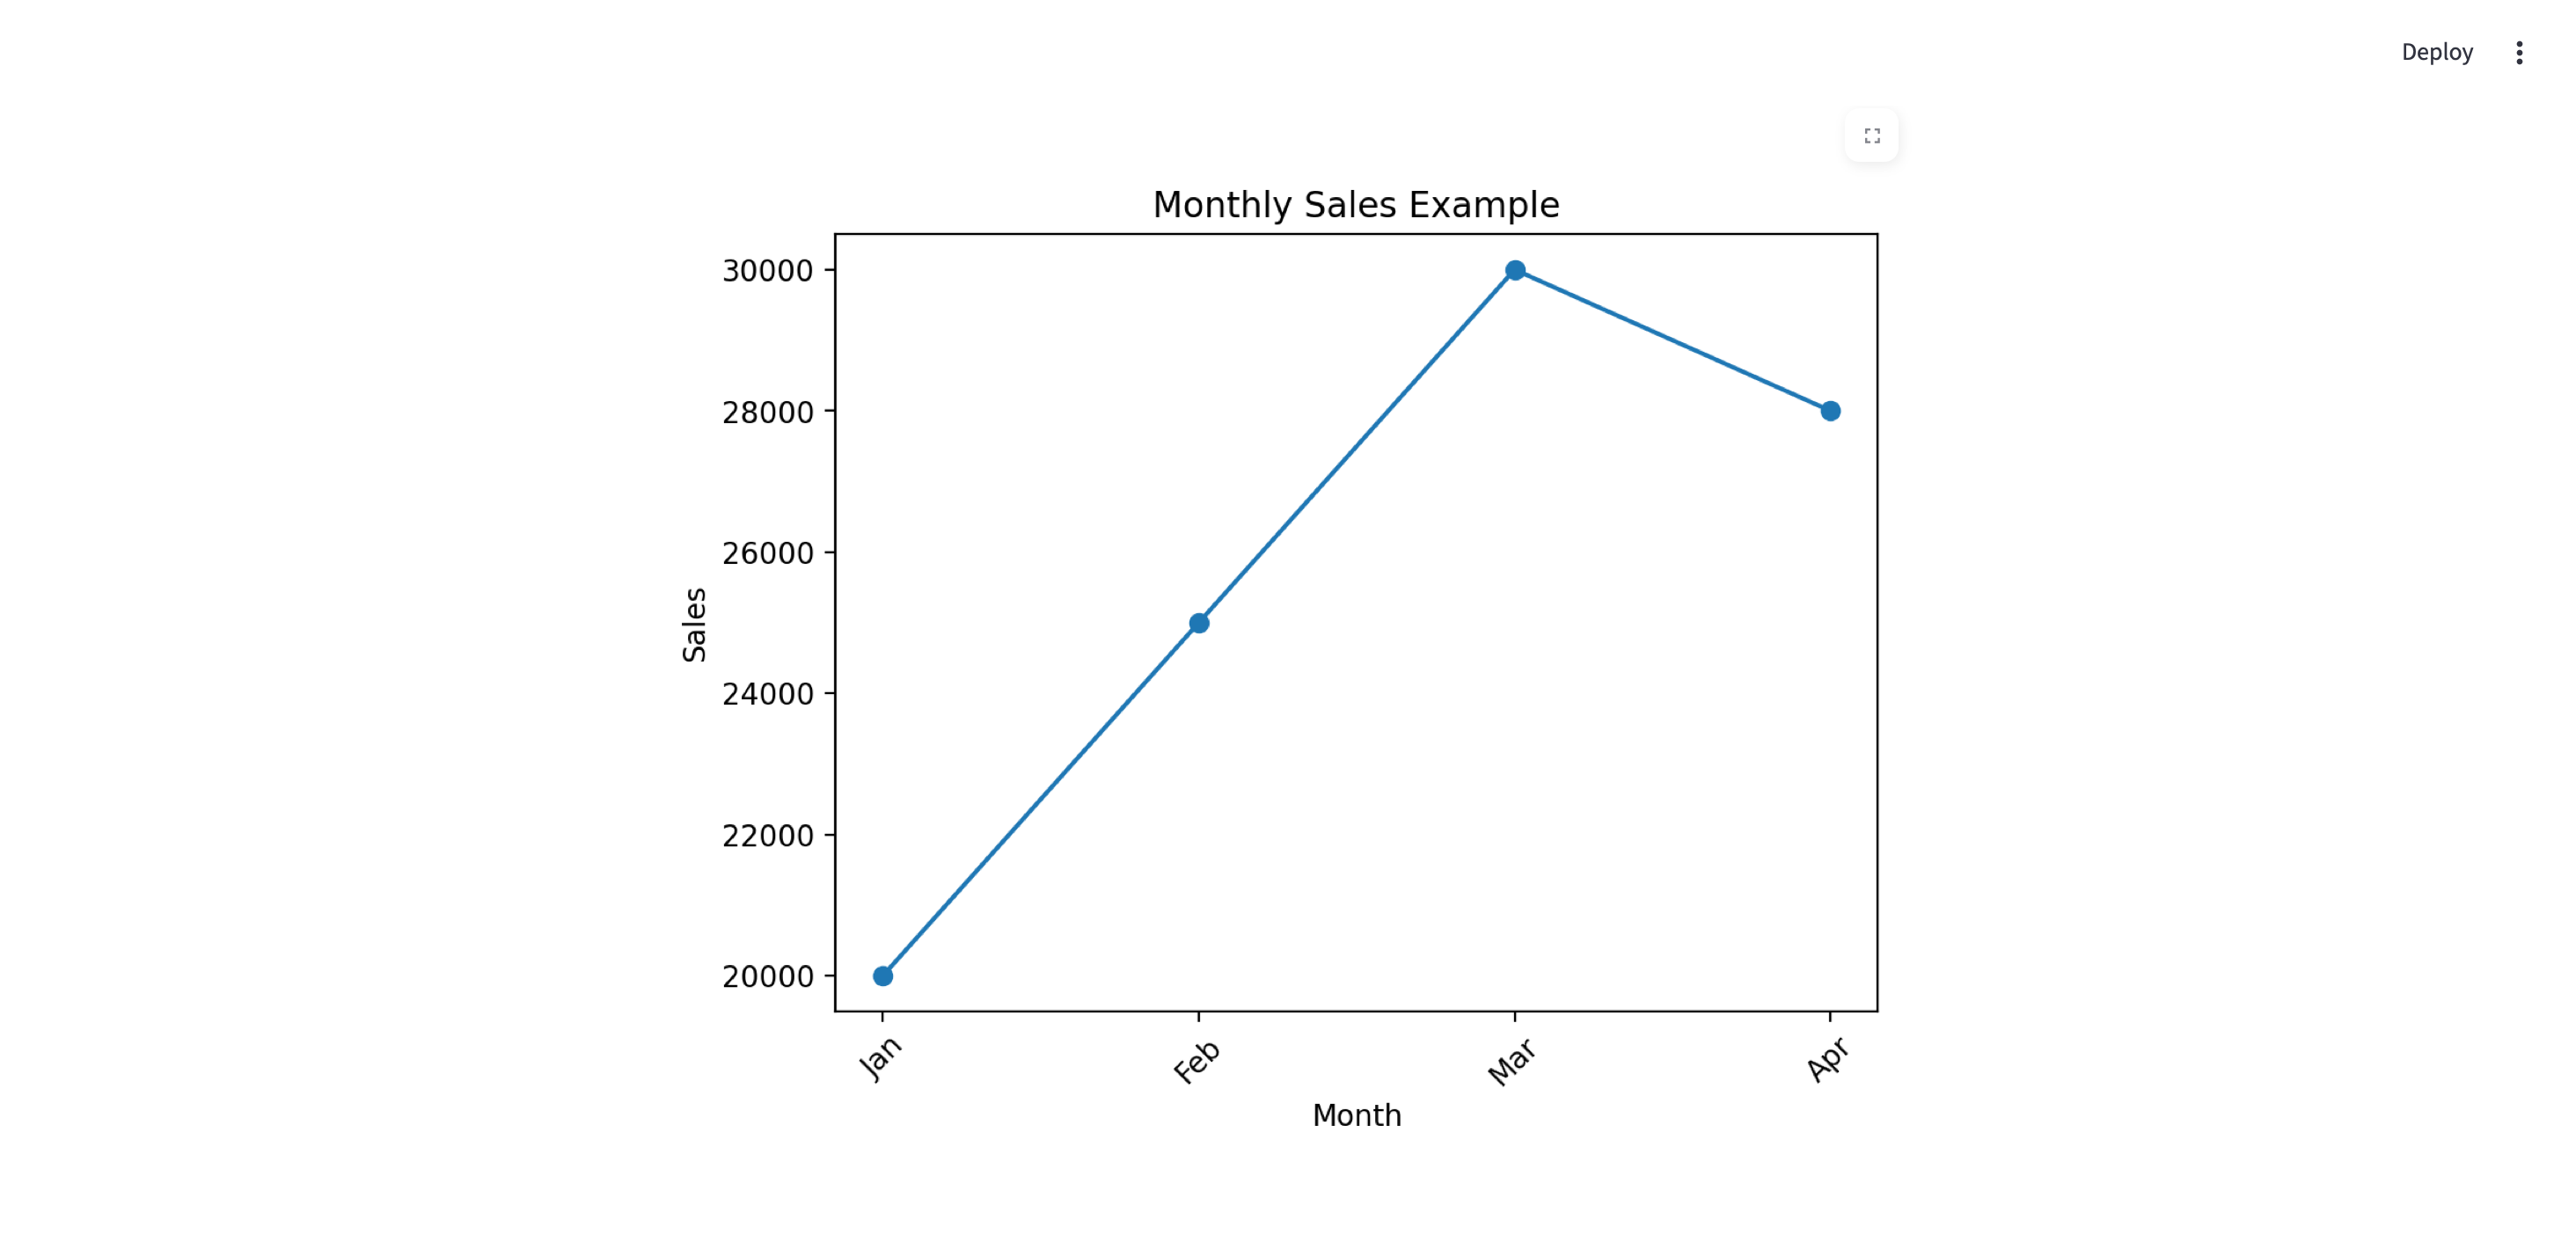
이 방식은 그래프를 세밀하게 커스터마이징할 때 유용하다.
Streamlit 시각화의 장점
Streamlit을 활용한 데이터 시각화의 장점은 다음과 같다.
- Python 코드만으로 웹 대시보드 생성
- 사용자 입력 기반 인터랙티브 그래프
- 빠른 프로토타이핑
- 데이터 분석 결과 공유에 적합
특히 데이터 분석이나 데이터 엔지니어링 환경에서 간단한 대시보드나 실험용 데이터 시각화 도구로 많이 사용된다.
정리
Streamlit을 사용하면 Python 코드만으로도 데이터 시각화와 사용자 인터페이스를 쉽게 만들 수 있다.
이번 글에서는
- st.line_chart()
- st.bar_chart()
- st.slider()
- st.pyplot()
등을 활용하여 데이터 시각화와 사용자 입력 기능을 구현해보았다.
이러한 기능을 활용하면 데이터 분석 결과를 훨씬 직관적으로 전달할 수 있는 웹 앱을 만들 수 있다.
Python과 데이터 분석을 공부하는 과정에서 Streamlit은 데이터 결과를 시각적으로 보여주는 매우 유용한 도구가 된다.
'Python & SQL > Python Basics' 카테고리의 다른 글
| 20. [Streamlit] 설치부터 첫 화면까지 (0) | 2026.03.08 |
|---|---|
| 19. [파이썬] 정렬 기술과 유용한 유틸 함수 (0) | 2026.03.08 |
| 18. [파이썬] 모듈과 프로젝트 구조 (2) | 2026.03.08 |
| 17. [파이썬] 클로저와 데코레이터 (2) | 2026.03.08 |
| 16. [파이썬] class methos vs static method (2) | 2026.03.08 |